
The dashboard provides in-depth analytics on how the business and sales team are responding to leads. (Note: The analytics dashboard is not available on the Basic plan.)
Dashboard Features:
- Overview of how your business is performing within any given timeframe, including:
- Lead volume
- Acceptance rates
- Delinquency
- Response times
- Agent performance overview, including:
- Lead acceptance vs. timed-out leads
- Average response times
- Expandable agent row with detailed performance data, including:
- Leads offered vs. accepted, declined, or timed-out
- Customer contact status, including deals in progress, closed deals, and unsuccessful deals
- Average number of comments per lead
This feature will allow you to determine return on investments and identify which agents are performing optimally. There is an exportable version that is accessible by clicking the download button in the top right corner. This provides more detailed information within a CSV file.
Dates
The dashboard will by default load the last 30 days of leads. This can be changed by inputting different dates along the top row and then hitting the refresh button.
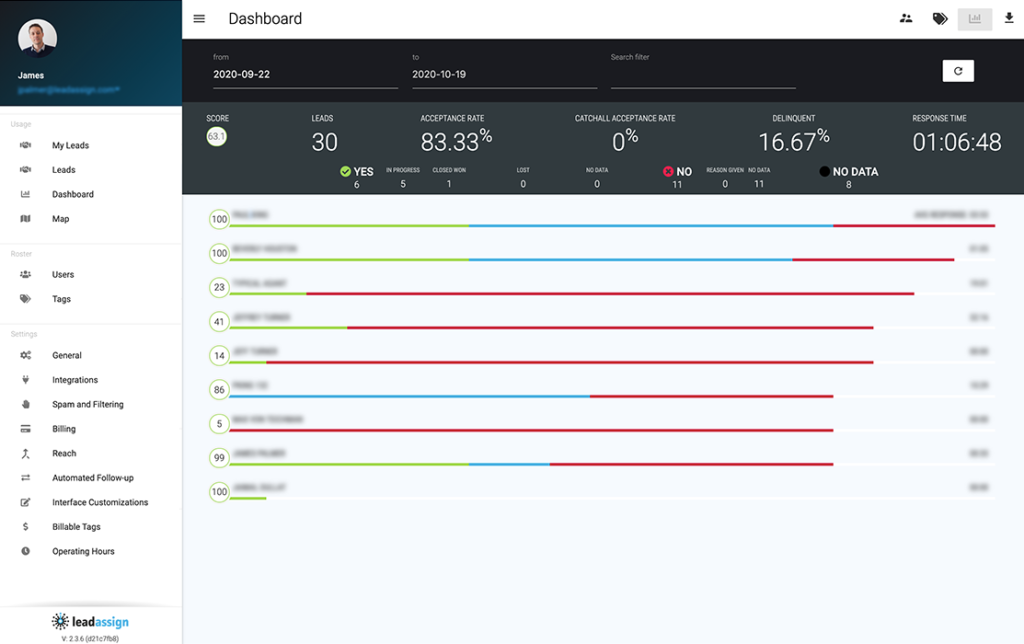
Company Stats Row

Company Score is calculated as an average of all the agents within an organization.
Score
An agent’s performance score is dictated by the agent’s interaction with lead offers within the date range. If an agent accepts a lead they will get +2 score. If an agent declines a lead, has a lead coalesce to them, or assigned to them they will get +1 score. If an agent times out they will receive -5 score. If an agent re-queues a lead they will get +4 score as well as +1 for accepting. Providing feedback increases score by up to 4. This excludes feedback changes since their last lead. Score starts at 100.
Leads
The total number of leads received within the given timeframe.
Acceptance Rates
The percentage of leads that have been accepted by an agent or admin. Accepted means the user as elected to deal with the lead.
Ideally, this number is high.
Catchall Acceptance Rates
The percentage of leads that have been accepted by a catchall. Accepted means the catchall as elected to deal with the lead.
Ideally, this number is low.
Delinquency Rates
Leads that have not been assigned or accepted and are not pending are considered delinquent.
Response Time
This is the median time it takes for a lead to be accepted. Hovering on the number will also show the mean value.
Conversion Stats

These stats provide a quick overall view of conversion progress across all leads that have been accepted. For example, in this case, 24 leads have been accepted out of the 30 (Yes, I was able to reach them:6, No, I was unable to reach them: 11, No information provided: 8). Within each main section, you will notice additional details. These numbers should always total their parent. E.g. Of the 6 that were successfully contacted 5 are in progress and 1 was won.
Agent Performance Rows
Each agent has a bar from left to right:
- Green is accepted leads
- Blue is declined leads
- Red is timed-out leads (or leads that have been missed).
Hovering on the row will show you how many leads in each category.
The number in the circle is the Performance Score. Performance score is a calculation for how well the agent interacts with the platform. It is not necessarily tied to how well they perform as a salesperson.
The platform keeps track of how agents interact and rewards certain things such as:
- Acceptance
- When feedback is provided
- The depth of feedback provided
- Even a declined lead is positive as it lets you know the lead was not right for them.
Things that negatively impact performance score:
- Not responding to lead offers
- Not providing feedback
Agent detail stats (open row)
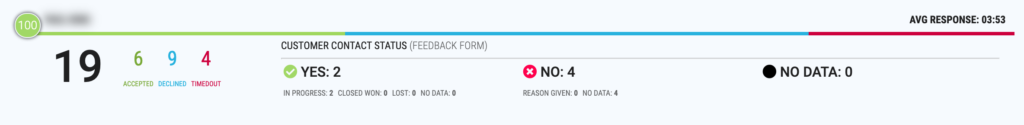
Click in an agent row will open up more stats similar to the company stats above, but only referring to the individual agent. The first number is the total number of leads they were offered (excluding coalesced leads). Of those, you will see how many were accepted, declined, and timed-out.
The rest of the stats on this row refer to post-acceptance conversion tracking. In the example provided the agent had accepted 6 leads. Of those, 2 were successfully contacted and both are “in-progress”. 4 have not been successfully contacted.